Key insights
-
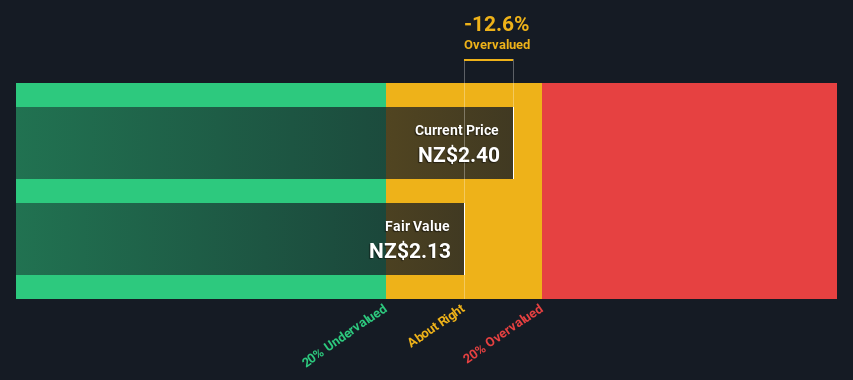
Scott Technology’s estimated fair value is NZ$2.13 based on the dividend discount model
-
Scott Technology’s NZ$2.40 share price indicates it is trading at levels similar to its fair value estimate
-
Scott Technology peers are currently trading at a 25% discount on average
Does the Scott Technology Limited (NZSE:SCT) share price in May reflect how much it is really worth? Today, we will estimate the intrinsic value of stocks by projecting their future cash flows and then discounting them to their current value. We will use the Discounted Cash Flow (DCF) model on this occasion. Models like these may seem beyond a layman’s understanding, but they are quite easy to follow.
Please note that there are many ways to value a company and, like DCF, each technique has advantages and disadvantages in certain scenarios. For those who enjoy learning equity analysis, the Simply Wall St analysis model here might be something of interest to you.
See our latest analysis for Scott Technology
The model
Since Scott Technology operates in the machinery industry, we need to calculate intrinsic value a little differently. In this approach, dividends per share (DPS) are used, since free cash flow is difficult to estimate and is often not reported by analysts. Unless a company pays out most of its FCF as a dividend, this method will typically underestimate the value of the stock. The “Gordon Growth Model” is used, which simply assumes that dividend payments will continue to increase at a sustainable growth rate forever. For a number of reasons, a very conservative growth rate is used that cannot exceed that of a company’s Gross Domestic Product (GDP). In this case we use the 5-year average of the yield on 10-year government bonds (2.7%). The expected dividend per share is then discounted to today’s value at a cost of equity of 8.3%. Relative to the current share price of NZ$2.4, the company appears at around fair value at the time of writing. Assessments are imprecise instruments, like a telescope – they move a few degrees and end up in a different galaxy. Keep this in mind.
Value per share = Expected dividend per share / (Discount rate – Perpetual growth rate)
= NZ$0.1 / (8.3% – 2.7%)
= NZ$2.1
The assumptions
We would like to point out that the most important data for a discounted cash flow are the discount rate and, of course, the real cash flows. If you don’t agree with these results, try the calculation yourself and play with the assumptions. The DCF also does not consider the possible cyclicality of an industry, or a company’s future capital needs, so it does not give a complete picture of a company’s potential performance. Since we are considering Scott Technology as potential shareholders, the cost of equity is used as the discount rate, rather than the cost of capital (or weighted average cost of capital, WACC) that accounts for debt. In this calculation we use 8.3%, which is based on a leveraged beta of 1.224. Beta is a measure of a stock’s volatility, compared to the market as a whole. We derive our beta from the average industry beta of globally comparable companies, with an imposed threshold between 0.8 and 2.0, which is a reasonable range for a stable business.
SWOT Analysis for Scott Technology
Strength
Weakness
Opportunity
Threat
Looking to the future:
While important, calculating DCF is just one of many factors you need to evaluate for a company. DCF models are not the be all and end all of investment evaluation. Instead, the best use of a DCF model is to test certain assumptions and theories to see if they would lead to the company being undervalued or overvalued. For example, if the terminal value growth rate is adjusted slightly, it can drastically change the overall result. For Scott Technology, there are three relevant items you should research further:
-
Scratchs: For example, we discovered 3 warning signs for Scott Technology (1 should not be ignored!) that you should know before investing here.
-
Future Profits: How does SCT’s growth rate compare to its peers and the broader market? Dive deeper into the analyst consensus number for the coming years by interacting with our free chart of analyst growth expectations.
-
Other solid businesses: Low debt, high returns on equity and good past performance are fundamental to a strong business. Why not explore our interactive list of stocks with strong business fundamentals to see if there are any other companies you might not have considered!
PS. Simply Wall St updates its DCF calculation for every New Zealand share every day, so if you want to find the intrinsic value of any other share, just search here.
Do you have feedback on this article? Worried about the content? Get in touch with us directly. Alternatively, email the editorial team (at) Simplywallst.com.
This Simply Wall St article is general in nature. We provide commentary based on historical data and analyst forecasts using only an unbiased methodology and our articles are not intended to be financial advice. It does not constitute a recommendation to buy or sell any stock and does not take into account your objectives or financial situation. Our goal is to bring you long-term focused analysis driven by fundamental data. Please note that our analysis may not take into account the latest price-sensitive company announcements or qualitative materials. Simply Wall St has no position in any of the stocks mentioned.